Performance
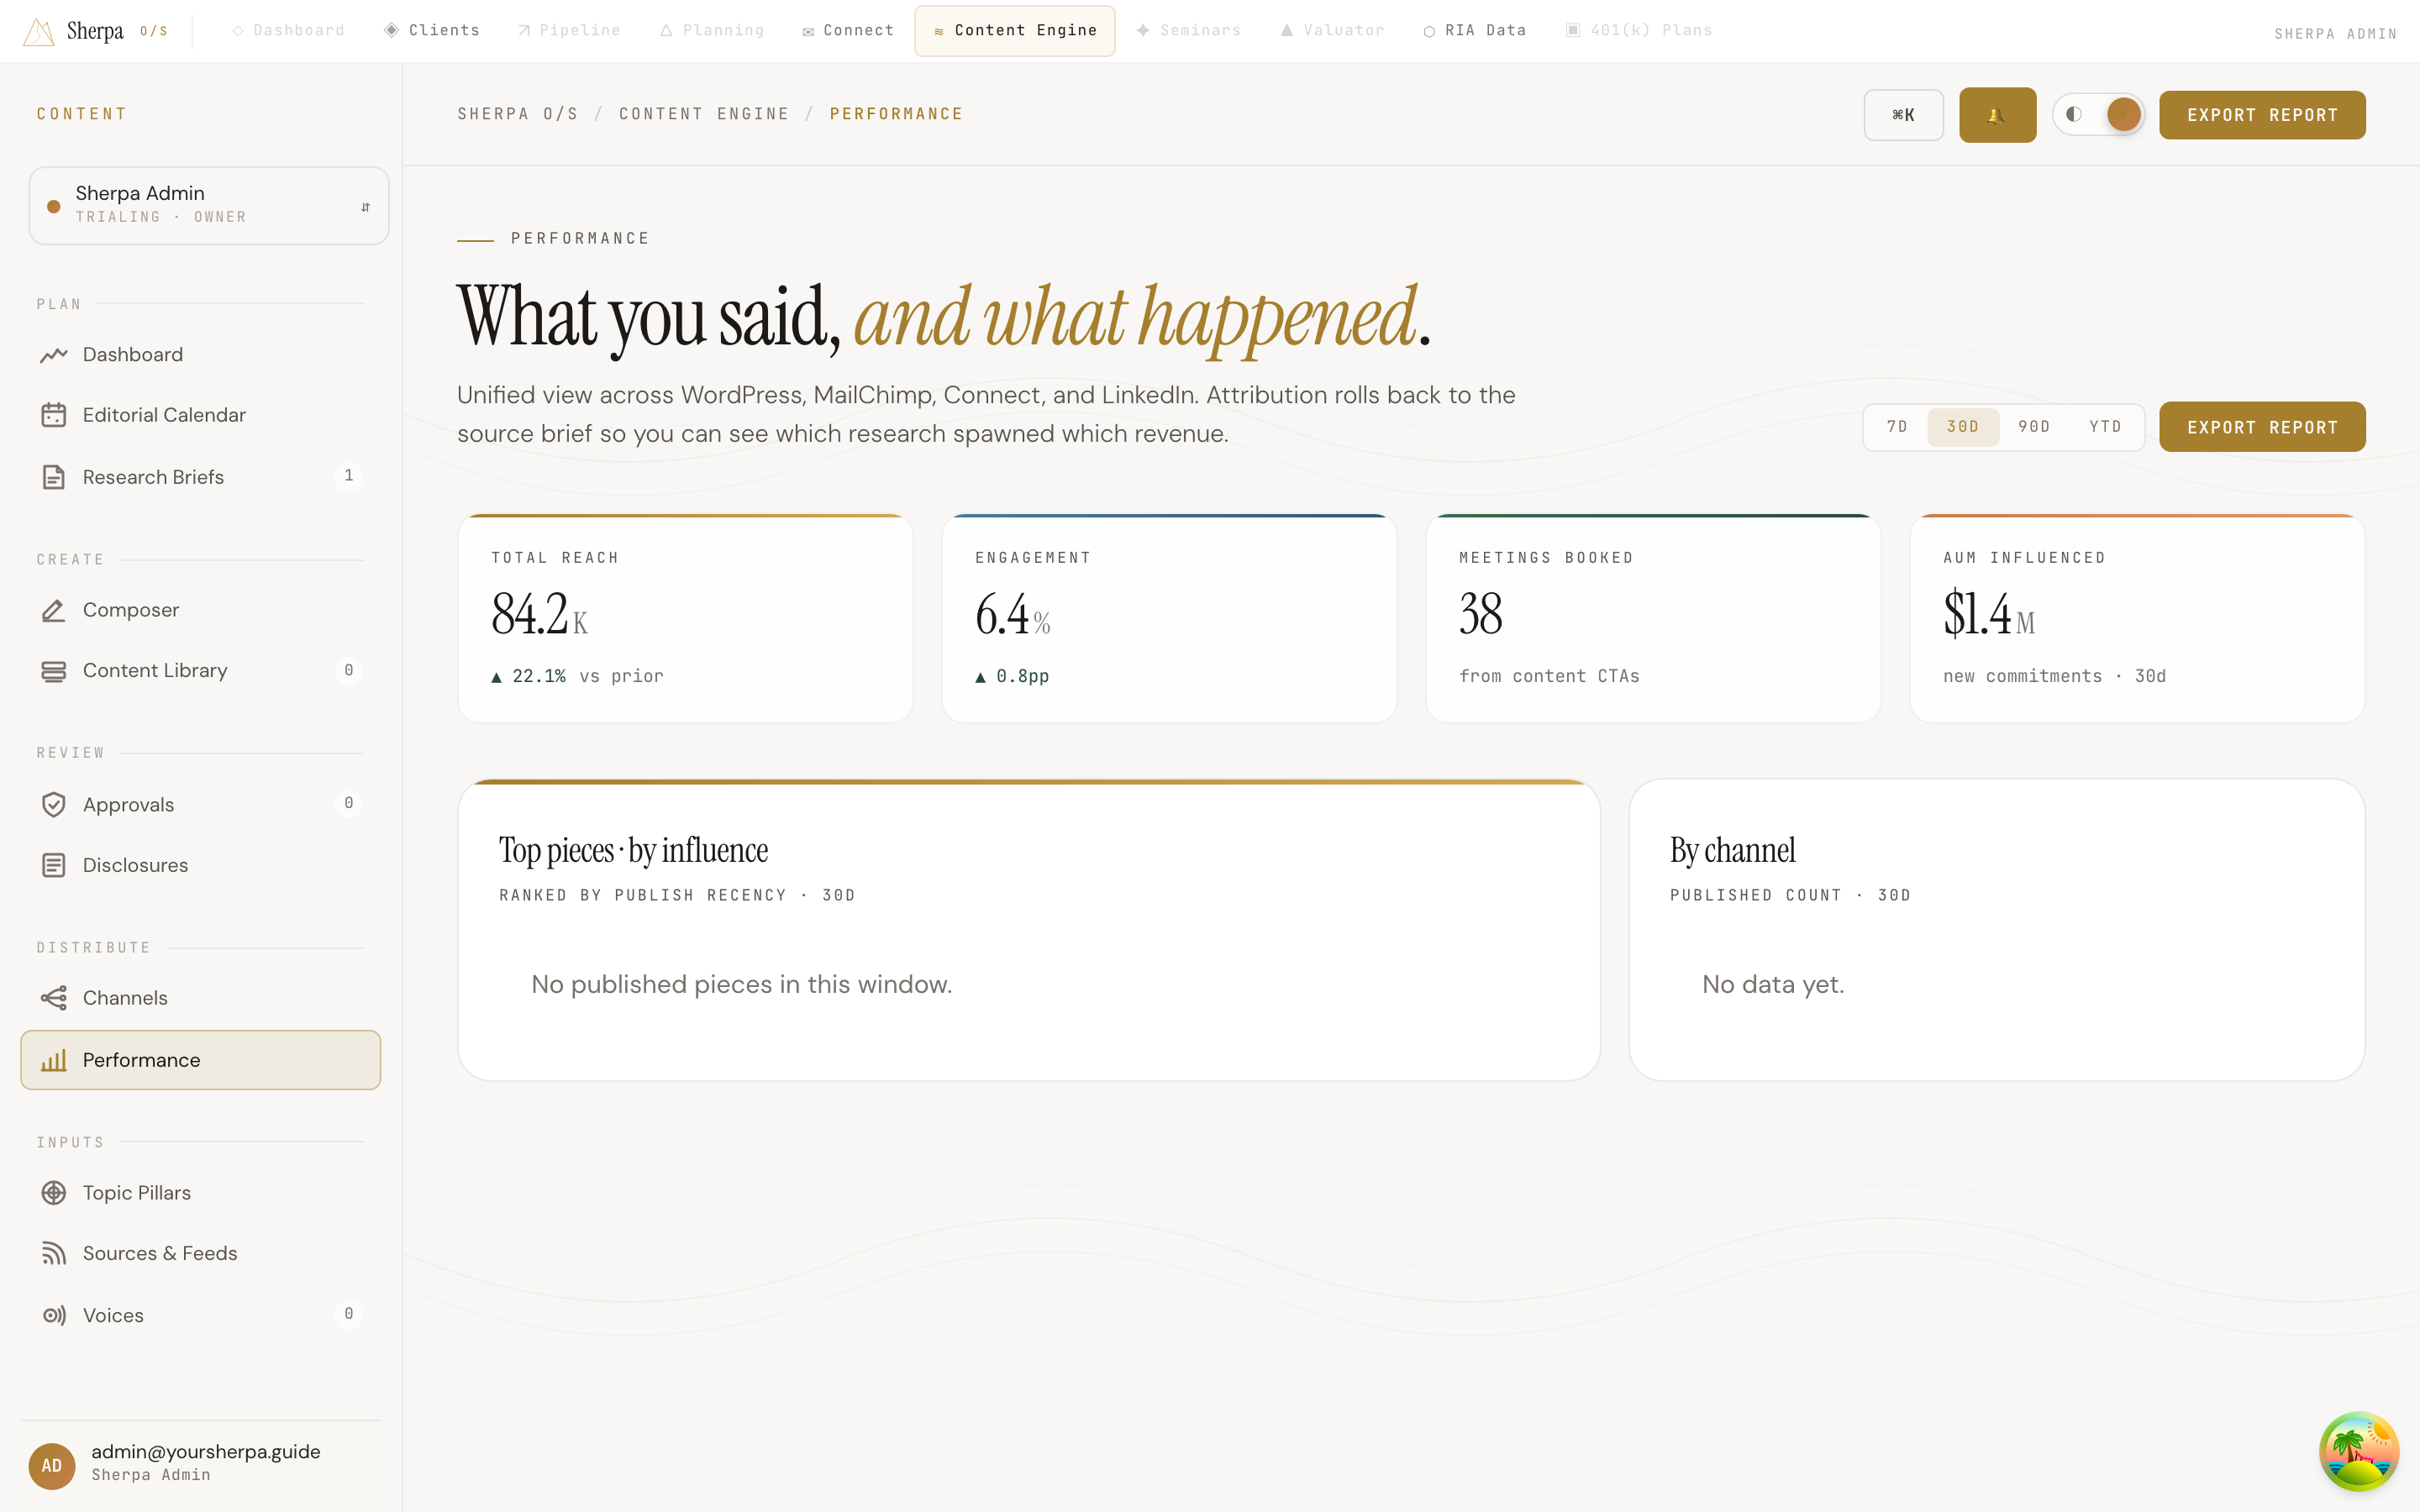
The Performance screen gives you a unified view of how your published content is landing — across WordPress, MailChimp, Connect, and LinkedIn — all in one place. Use it to understand which pieces are driving the most influence and which channels are most active over any time window you choose.
Getting there
Section titled “Getting there”In the app, navigate to Content Engine → Distribute → Performance.
What you can do
Section titled “What you can do”Choose a time window
Section titled “Choose a time window”At the top right of the page, four toggle buttons let you switch the reporting period: 7d, 30d, 90d, and ytd. Every stat, chart, and ranking on the page updates to reflect the selected window. The default view is the last 30 days.
Read the summary stats
Section titled “Read the summary stats”Four headline numbers run across the top of the page:
- Total reach — combined audience reached across all connected channels, shown in thousands.
- Engagement — the blended engagement rate across channels, shown as a percentage.
- Meetings booked — meetings attributed to content call-to-action links within the selected window.
- AUM influenced — new commitments associated with content activity in the selected window.
Review top pieces by influence
Section titled “Review top pieces by influence”The Top pieces · by influence panel lists up to six published pieces ranked by recency within the selected window. Each row shows:
- The piece title.
- The channel it was published to (for example, LINKEDIN or MAILCHIMP) and, when available, the source brief title so you can trace the content back to the research idea that spawned it.
- A word-count indicator.
- A color-coded bar that reflects its relative influence ranking.
If no pieces have been published in the selected window, the panel displays “No published pieces in this window.”
Review activity by channel
Section titled “Review activity by channel”The By channel panel shows a breakdown of how many pieces were published to each connected channel within the window. Each row names the channel and its published piece count. If no data exists yet, the panel displays “No data yet.”
Export a report
Section titled “Export a report”Use the Export report button in the top-right header to download performance data for the selected window.