Connect dashboard
The Connect dashboard is the first screen you see after signing in. It gives you a single view of everything happening across your campaigns, automated flows, and cold outbound — so you can spot what’s working and act on anything that needs attention before your day starts.
Getting there
Section titled “Getting there”In the left-hand navigation, go to Connect, then Overview. The dashboard is the default landing screen, so signing in takes you there automatically.
What you can do
Section titled “What you can do”Read your daily headline
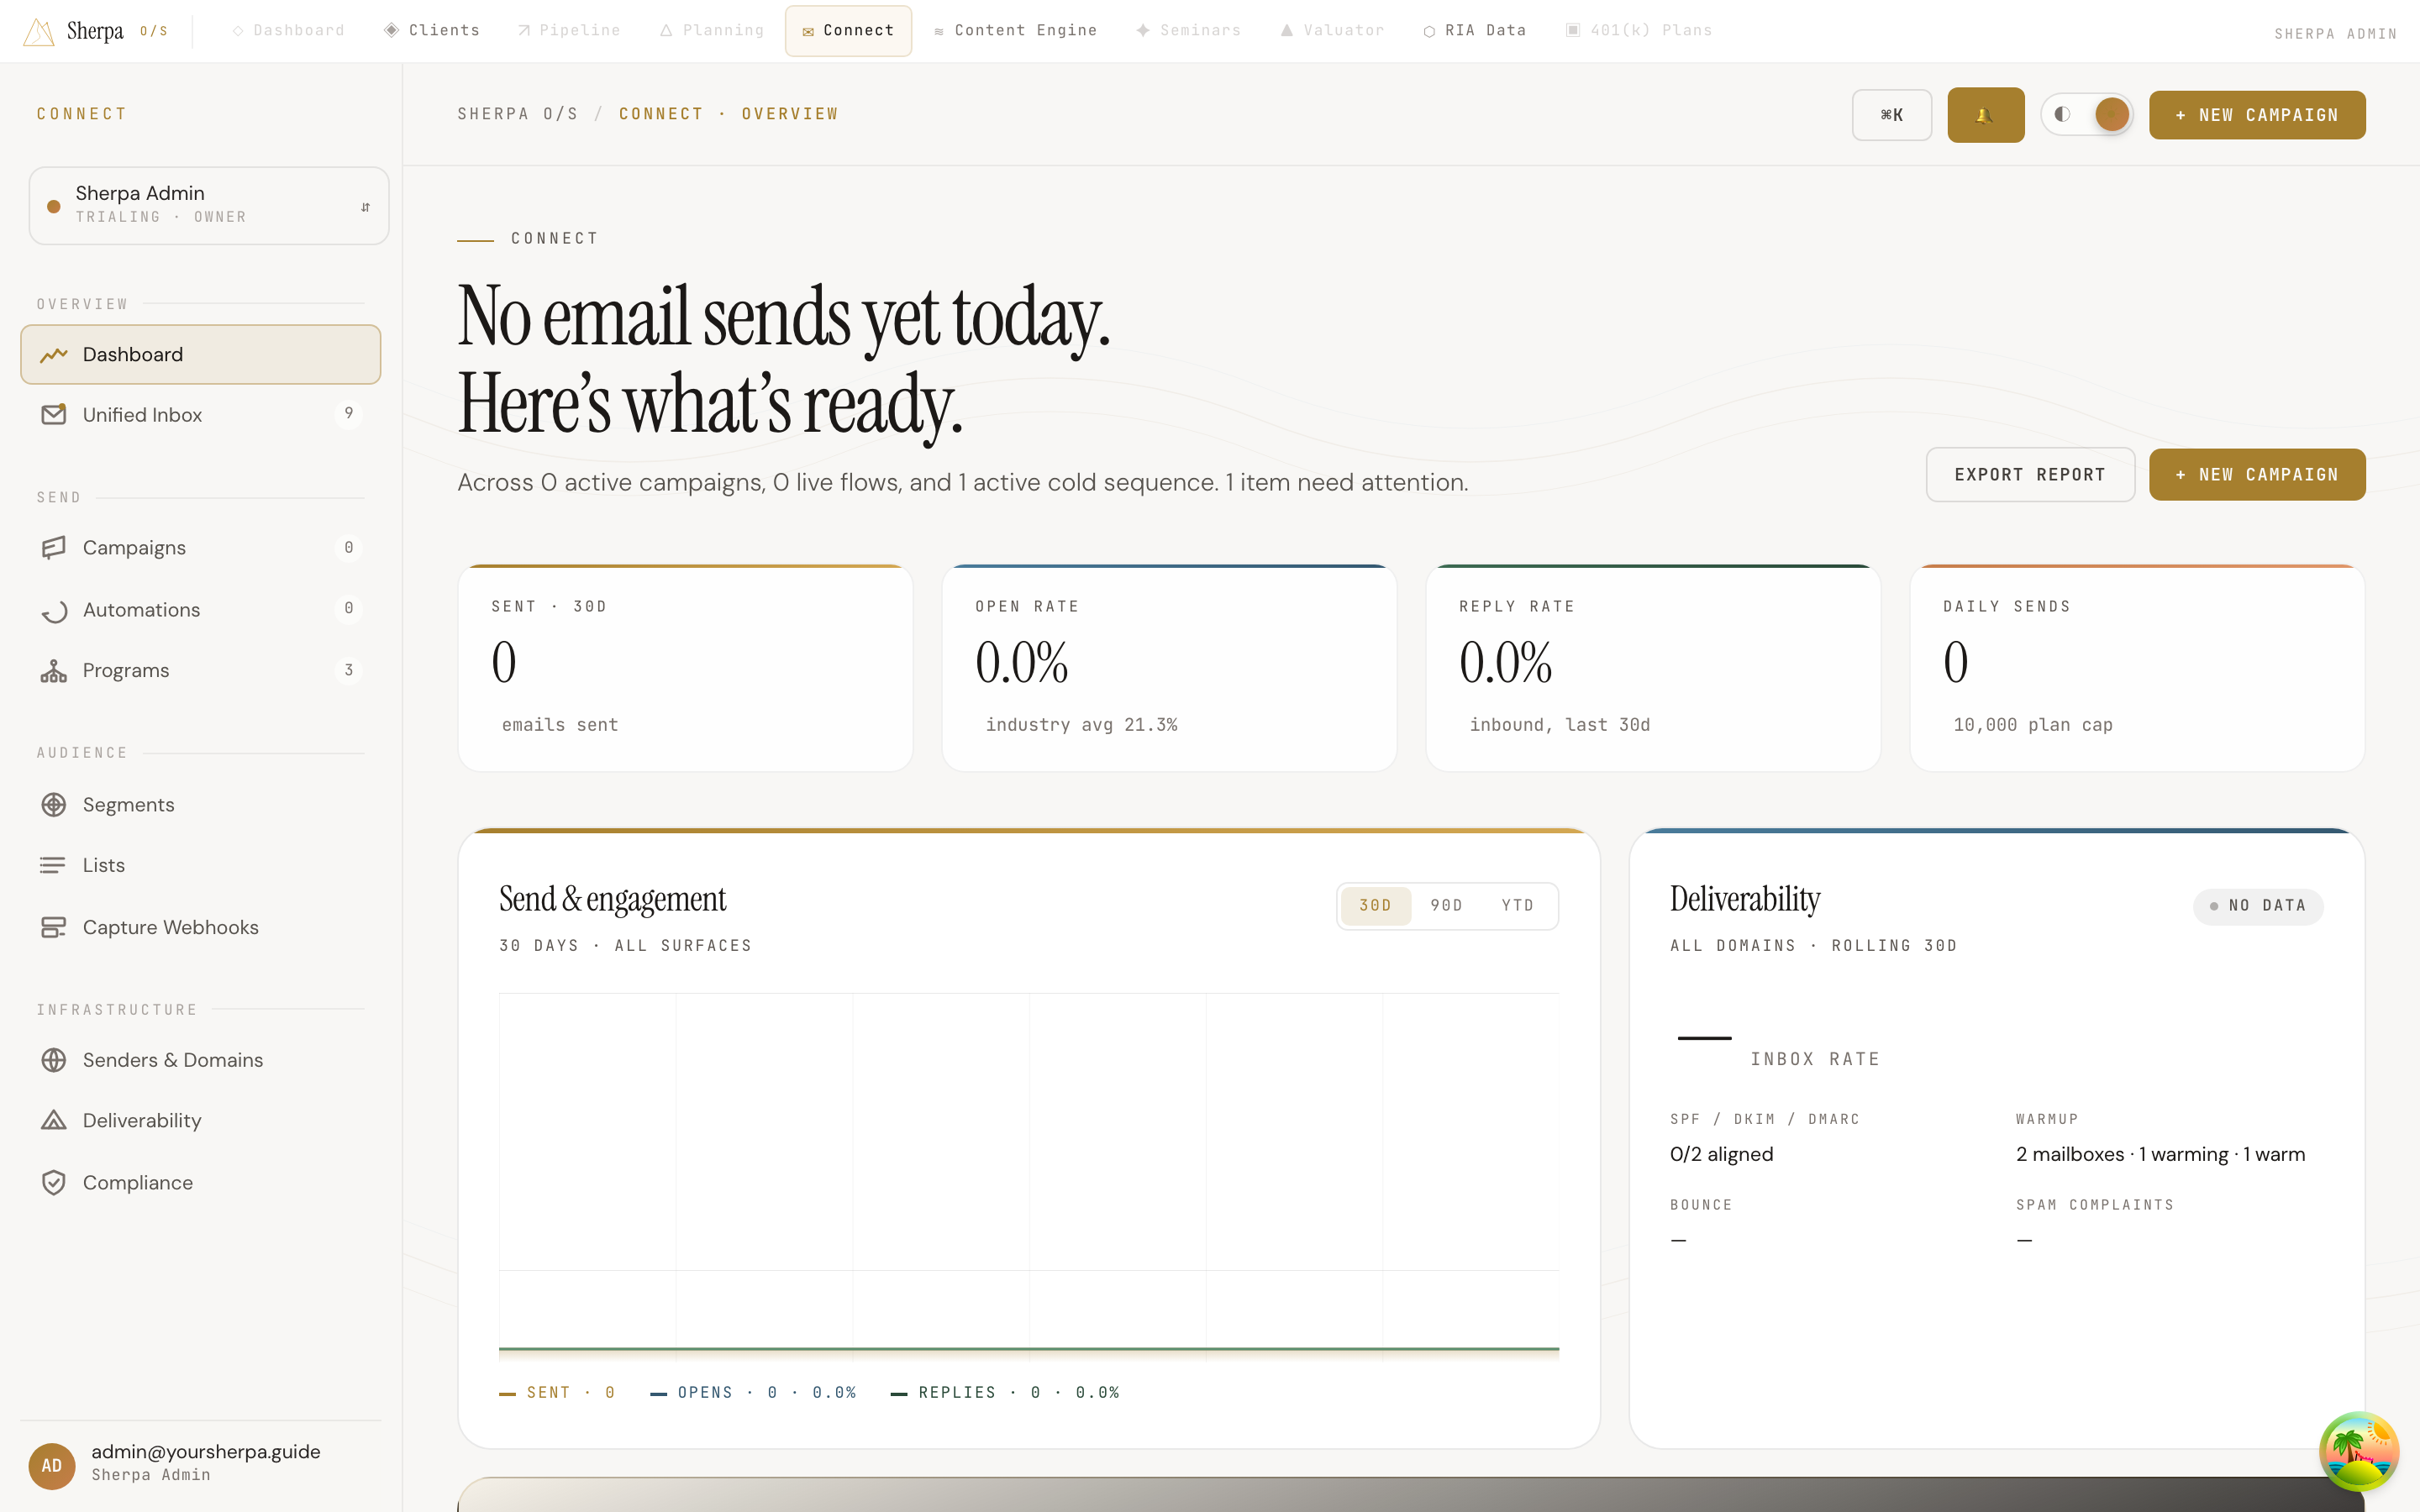
Section titled “Read your daily headline”The top of the page tells you how many emails have gone out today and surfaces a quick summary of active campaigns, live flows, and running cold sequences. If anything needs your attention right now, you’ll see a count here too.
Review your key metrics
Section titled “Review your key metrics”Four stat tiles span the top of the page:
- Sent (30d) — total emails sent over the trailing 30 days.
- Open rate — your aggregate open rate for the same window, compared against an industry average of 21.3%.
- Reply rate — inbound replies over the last 30 days.
- Daily sends — how many emails you’ve sent today against your plan’s daily cap.
Understand send trends with the chart
Section titled “Understand send trends with the chart”The Send & engagement panel shows a 30-day sparkline with three lines: sends (gold), opens (blue), and replies (green). Use the 30d / 90d / YTD toggle in the panel header to change the window.
Check deliverability health
Section titled “Check deliverability health”The Deliverability card shows:
- Inbox rate — the percentage of messages reaching the inbox, rolling 30 days.
- A health badge — Healthy (95%+), Watch (90–94%), or Review (below 90%).
- SPF / DKIM / DMARC alignment across your sending domains.
- Warmup — how many mailboxes are currently warming and how many are fully warm.
- Bounce and Spam complaint rates.
Act on attention items
Section titled “Act on attention items”If the attention panel lists any items — such as a domain alignment issue, a paused warmup, or a compliance queue backlog — click Review to go directly to the relevant screen. When there are no open items, the panel confirms that your domains, warmup, campaigns, and compliance queue are all clear.
See your top-performing sends
Section titled “See your top-performing sends”The Top-performing sends table lists campaigns by open rate over the trailing 30 days. Columns show the campaign name, type (Broadcast, Flow, or Cold sequence), a visual open-rate bar, and recipient count. Click All campaigns → to view the full list.
Monitor live activity
Section titled “Monitor live activity”The Live panel streams real-time delivery events — sends, opens, clicks, bounces, and failures — as they happen. Each row shows the event type, the campaign it belongs to, and how long ago it occurred.
Navigate to a specific area
Section titled “Navigate to a specific area”Four shortcut tiles at the bottom link directly to Campaigns, Flows, Cold outbound, and the Email editor. Each tile shows a live count — active campaigns, live automations, paused sequences, and drafts — so you can see at a glance where work is waiting.
Start something new
Section titled “Start something new”Use the + New campaign button in the top-right corner to open the email editor, or click Export report to download a summary of your Connect activity.